基于thanos搭建分布式prometheus
prometheus存在单点问题,具体痛点可以这么描述:
prometheus单机存储和抓取能力都有上限,容易单点故障。
虽然有一种方式是通过部署N个prometheus分别抓取不同的target来分摊压力的,但是grafana就要为不同的图表配置不同的prometheus地址,复杂程度比较棘手。
thanos+prometheus可以解决这个问题,它提供了一个核心能力:
1,thanos querier组件可以反向代理到N个prometheus,然后grafana直接指向thanos querier即可,thanos querier会从N个prometheus同时查询数据,返回满足Promql的数据结果;
2,如果N个prometheus抓取的数据存在重复的,那么thanos querier会根据label自动去重,确保返回给grafana的数据不会重复,这个特性很关键。
有了thanos querier组件,我们可以很简单的解决单点故障问题:
部署N个prometheus同时抓取数据,然后thanos querier代理它们,这样prometheus挂了一台也不影响服务,数据在其他prometheus上还有。
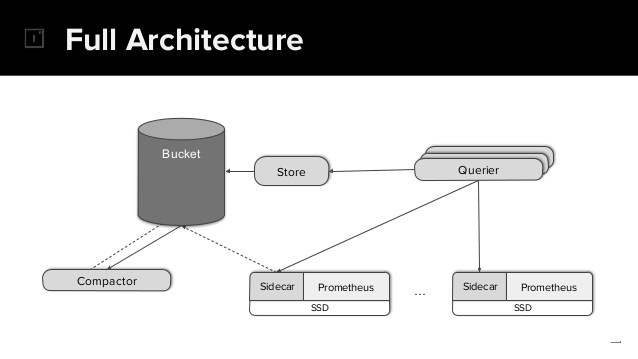
方案1:thanos sidecar + thanos querier
实际上,querier不能直接反向代理prometheus,而是需要在prometheus的POD内部署一个thanos sidecar组件,querier反向代理至sidecar,再由sidecar查询POD内的prometheus。
querier和sidecar之间走GRPC协议,POD内的sidecar和prometheus则走原生HTTP接口拿数据。
为了高可用,我们可以部署多个prometheus同时抓取。
为了打散采集/存储压力,我们可以部署多个prometheus各自抓取部分数据。
无论出于上述哪种目标或者混合目标,最终依靠Querier的正确配置都可以提供统一的Promql查询入口给Grafana,这一点是毋庸置疑的。
这里看到了图中有几个陌生的组件:
- Store
- Bucket
- Compactor
Prometheus单机存储空间有限,SideCar和Prometheus在同POD内共享数据volume,然后sidecar可以自动将prometheus磁盘数据上传到Bucket里归档存储;后续Querier可以通过Store组件从Bucket拉取到历史数据,这样就实现了历史数据的永久存储和查询能力。
Compactor则是对Bucket里的历史数据进行采样或者清理,有具体需求后再自行研究即可。
上述组件均是可选的,没有历史数据永存需求的可以直接忽略。
方案2:thanos receive + thanos querier
thanos提供的另一种方案是计算与存储分离,利用thanos receive组件部署一个分布式存储集群,然后令prometheus通过remote write机制直接写入到thanos receive集群完成分布式存储,这样prometheus本身就无状态了。
再利用thanos querier反向代理到thanos receive集群,最终对外提供统一的promql查询入口,这个阶段就没有prometheus什么事了。
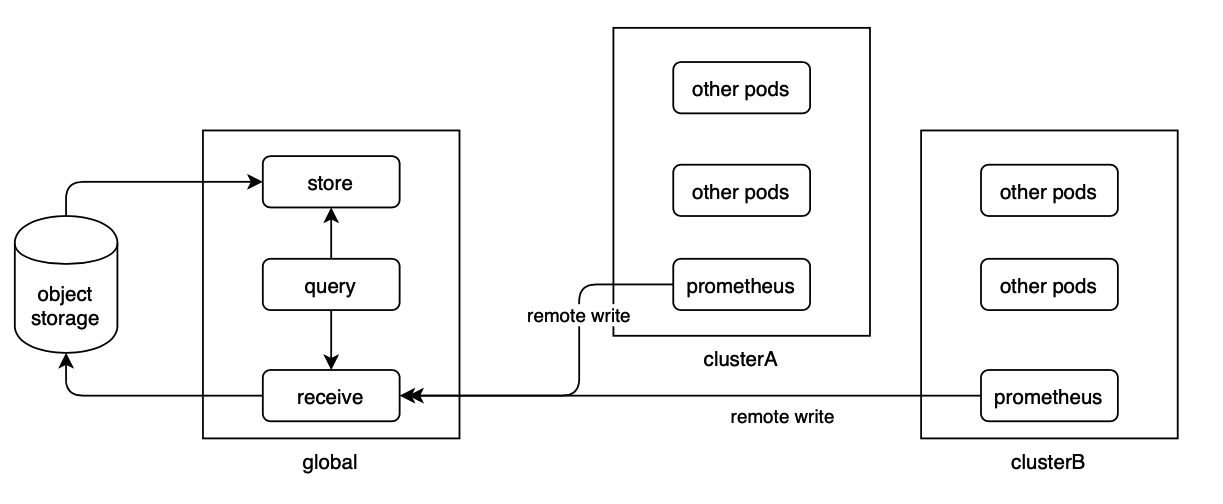
这套方案的工作原理如下:
thanos receive组件需要部署N个进程组成集群,prometheus可以remote write写入数据到任意receive节点,收到写入请求的receive节点根据metrics label做哈希后计算出负责存储该部分数据的receive节点,并将数据转发过去;
同时,receive可以配置replica数量,这样的话receive会根据哈希结果将数据复制给多个receive做冗余,应该说是非常简单粗暴的复制方案吧,因为监控场景没那么严谨所以基本可用即可,查询去重和归拢则全部依靠querier组件反向查询所有Receive组件搞定。
我们的选择
让prometheus直接配置remote write的方式看起来更好一些,我们只需要在启动一套thanos receive集群,然后让prometheus切过去就可以了,这比配置sidecar的方式感受起来要好很多,也是腾讯TKE团队选择的大规模集群方案。
我发布了2个YAML,不需要任何改动,直接生效到集群中可以马上体验到效果:https://github.com/owenliang/thanos-prometheus
先部署thanos receive存储集群:
|
1 2 3 4 5 6 7 8 9 10 11 12 13 14 15 16 17 18 19 20 21 22 23 24 25 26 27 28 29 30 31 32 33 34 35 36 37 38 39 40 41 42 43 44 45 46 47 48 49 50 51 52 53 54 55 56 57 58 59 60 61 62 63 64 65 66 67 68 69 70 71 72 73 74 75 76 77 78 79 80 81 82 83 84 85 86 87 88 89 90 91 92 93 94 95 96 97 98 99 100 101 102 103 104 105 106 107 108 109 110 111 112 113 114 115 116 117 118 119 120 121 122 123 124 125 126 127 128 129 130 131 132 133 134 135 136 137 138 139 140 141 142 143 144 145 146 147 148 149 150 |
apiVersion: v1 kind: Service metadata: name: thanos-receive-nodeport namespace: monitoring spec: ports: - name: http port: 10902 protocol: TCP targetPort: 10902 - name: remote-write port: 19291 protocol: TCP targetPort: 19291 - name: grpc port: 10901 protocol: TCP targetPort: 10901 selector: app: thanos-receive type: NodePort --- apiVersion: v1 kind: Service metadata: name: thanos-receive namespace: monitoring spec: ports: - name: http port: 10902 protocol: TCP targetPort: 10902 - name: remote-write port: 19291 protocol: TCP targetPort: 19291 - name: grpc port: 10901 protocol: TCP targetPort: 10901 selector: app: thanos-receive # headless服务 clusterIP: None --- apiVersion: v1 kind: ConfigMap metadata: name: thanos-receive-config namespace: monitoring data: # 域名通过headless service规则可以预先获知:https://kubernetes.io/zh/docs/concepts/services-networking/dns-pod-service/#srv-records thanos-receive-hashrings: | [ { "endpoints": [ "thanos-receive-0.thanos-receive.monitoring.svc.cluster.local:10901", "thanos-receive-1.thanos-receive.monitoring.svc.cluster.local:10901", "thanos-receive-2.thanos-receive.monitoring.svc.cluster.local:10901" ] } ] --- apiVersion: apps/v1 kind: StatefulSet metadata: name: thanos-receive namespace: monitoring spec: replicas: 3 serviceName: thanos-receive selector: matchLabels: app: thanos-receive template: metadata: labels: app: thanos-receive spec: # 禁止2个POD出现在同一个node上 affinity: podAntiAffinity: requiredDuringSchedulingIgnoredDuringExecution: - labelSelector: matchExpressions: - key: app operator: In values: - thanos-receive topologyKey: "kubernetes.io/hostname" containers: - args: - receive - --grpc-address=0.0.0.0:10901 - --http-address=0.0.0.0:10902 - --remote-write.address=0.0.0.0:19291 - --tsdb.path=/thanos-receive-data - --tsdb.retention=15d - --receive.replication-factor=2 - --receive.hashrings-file=/etc/thanos/thanos-receive-hashrings - --receive.local-endpoint=$(NAME).thanos-receive.$(NAMESPACE).svc.cluster.local:10901 - --label=replica="$(NAME)" name: thanos-receive image: registry-team.smzdm.com/prometheus/thanos:v0.18.0 volumeMounts: - mountPath: /etc/thanos name: thanos-receive-config - mountPath: /thanos-receive-data name: thanos-receive-data livenessProbe: failureThreshold: 10 httpGet: path: /-/healthy port: 10902 scheme: HTTP initialDelaySeconds: 60 periodSeconds: 5 successThreshold: 1 timeoutSeconds: 3 readinessProbe: failureThreshold: 10 httpGet: path: /-/ready port: 10902 scheme: HTTP initialDelaySeconds: 60 periodSeconds: 5 successThreshold: 1 timeoutSeconds: 3 env: - name: NAME valueFrom: fieldRef: fieldPath: metadata.name - name: NAMESPACE valueFrom: fieldRef: fieldPath: metadata.namespace terminationGracePeriodSeconds: 60 volumes: - name: thanos-receive-data hostPath: path: /data/thanos-receive-data type: DirectoryOrCreate - name: thanos-receive-config configMap: name: thanos-receive-config |
细节大家可以自己慢慢看,我讲一下关键:
- 用statefulset部署集群,因为这是一个有状态的存储集群,不能随便漂移。
- 因为是分布式存储集群,要通过POD亲和性避免2个POD跑到1个Node上。
- 核心配置是声明receive集群的地址列表,这里利用headless service可以直接拿到每个POD的dns name,是有规则的。
- 每个thanos receive实例的启动参数中指定replica标签唯一标识它。
thanos-receive集群的19291端口是remote-write端口,后续Prometheus往集群的这个端口写入即可,具体数据在集群内再分发会由thanos receive自己搞定。
再部署thanos-querier即可:
|
1 2 3 4 5 6 7 8 9 10 11 12 13 14 15 16 17 18 19 20 21 22 23 24 25 26 27 28 29 30 31 32 33 34 35 36 37 38 39 40 41 42 43 44 45 46 47 48 49 50 51 52 53 54 55 56 57 58 59 60 |
piVersion: v1 kind: Service metadata: name: thanos-querier namespace: monitoring spec: ports: - name: http port: 9090 protocol: TCP targetPort: 9090 selector: app: thanos-querier type: NodePort --- apiVersion: apps/v1 kind: Deployment metadata: name: thanos-querier namespace: monitoring spec: replicas: 2 selector: matchLabels: app: thanos-querier template: metadata: labels: app: thanos-querier spec: containers: # thanos querier - args: - query - --http-address=0.0.0.0:9090 - --query.replica-label=replica - --store=dnssrv+_grpc._tcp.thanos-receive.monitoring.svc.cluster.local name: thanos-querier image: registry-team.smzdm.com/prometheus/thanos:v0.18.0 livenessProbe: failureThreshold: 10 httpGet: path: /-/healthy port: 9090 scheme: HTTP initialDelaySeconds: 60 periodSeconds: 5 successThreshold: 1 timeoutSeconds: 3 readinessProbe: failureThreshold: 10 httpGet: path: /-/ready port: 9090 scheme: HTTP initialDelaySeconds: 60 periodSeconds: 5 successThreshold: 1 timeoutSeconds: 3 terminationGracePeriodSeconds: 60 |
- thanos-querier需要指定反向代理的列表,它支持基于DNS SRV记录的服务发现机制,因为thanos querier部署在K8S集群内,所以直接走coredns的DNS SRV记录发现thanos receive的所有POD地址即可,对应参数:–store=dnssrv+_grpc._tcp.thanos-receive.monitoring.svc.cluster.local。
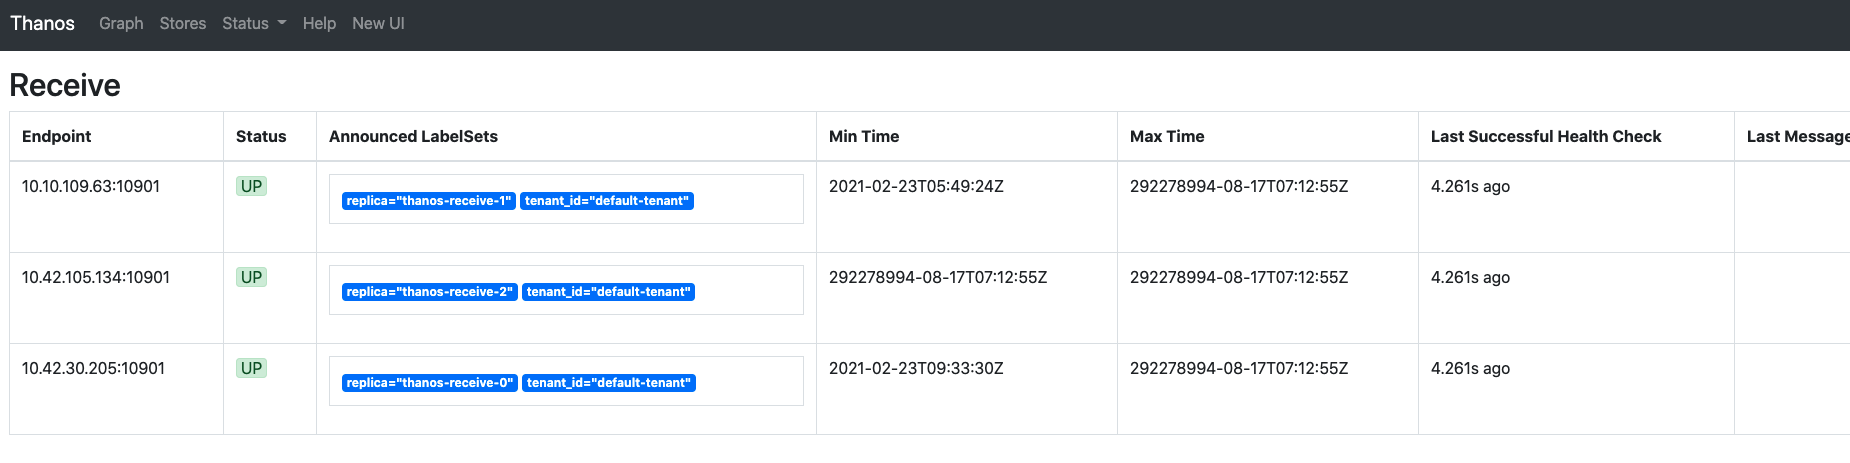
- 注意让querier忽略掉receive实例返回数据中的replica标签,这样多个receive返回的相同label数据才能判定为重复并被去重。
让grafana指向querier的http 9090端口即可,下图是thanos querier界面,它发现了3个receive store节点,同时对外提供和prometheus原生一模一样的查询界面和API:
最后配置prometheus的remote-write将数据写入到receive集群,这个是prometheus原生配置:
|
1 2 3 4 5 6 7 8 9 10 11 |
global: scrape_interval: 30s scrape_timeout: 10s evaluation_interval: 30s external_labels: cluster: 158 rule_files: - /etc/prometheus/rules/*.yml remote_write: - url: http://receive集群的service ip:19291/api/v1/receive scrape_configs: |
remote_write部分的IP填写receive集群对外暴露的入口IP,端口是receive组件的remote-write专用端口19291,URI部分是固定的。
最后
thanos官方提供了一个sidecar方案的交互式教程,帮助大家理解thanos整个组件关系和配置过程,建议学习:https://katacoda.com/thanos/courses/thanos,实际生产中建议采用方案2。
如果文章帮助您解决了工作难题,您可以帮我点击屏幕上的任意广告,或者赞助少量费用来支持我的持续创作,谢谢~
1