k8s系列 – k8s监控搭建(Prometheus+grafana)
本文档记录了k8s中prometheus+alertmanager+grafana的安装流程,点击下载:k8s监控搭建(Prometheus+grafana).docx 。
正文
以下内容由word文档直接导入,虽然排版差劲一点,但是可以方便大家可以在线查阅。
K8s监控搭建调研
背景介绍
K8S的监控方案淘汰很快,目前v1.12.0版本已经淘汰了heapster,未来的趋势将是prometheus+Grafana+alertmanager的技术栈。
Prometheus工作原理和配置非常的繁杂,学习唯有动手实践,这篇文档目标不是搭一个完美的方案,但应该为未来实施提供重要的基本思路。
下面先手动配置一个prometheus in cluster,演示prometheus基于k8s服务发现的scrape原理。
在理解原理后,我们后续可以选择开源的kube-prometheus项目来安装全套的监控方案,当然这个版本也有很多问题,但至少我们懂原理了能维护了。
手动搭建prometheus
部署node-exporter
以daemonset的方式在每个node上跑一个node-exporter,它会采集机器资源使用情况,供prometheus抓取。
apiVersion: v1
kind: Service
metadata:
name: node-exporter
namespace: kube-system
labels:
app: node-exporter
annotations:
prometheus.io/should_be_scraped: “true”
prometheus.io/metric_path: “/metrics”
prometheus.io/scrape_port: “9100”
prometheus.io/scrape_scheme: “http”
spec:
clusterIP: None
ports:
– name: metrics
port: 9100
targetPort: 9100
protocol: TCP
selector:
app: node-exporter
type: ClusterIP
—
apiVersion: apps/v1beta2
kind: DaemonSet
metadata:
labels:
app: node-exporter
name: node-exporter
namespace: kube-system
spec:
selector:
matchLabels:
app: node-exporter
template:
metadata:
labels:
app: node-exporter
spec:
containers:
– name: node-exporter
image: quay.io/prometheus/node-exporter
args:
– ‘–path.procfs=/host/proc’
– ‘–path.sysfs=/host/sys’
volumeMounts:
– name: proc
mountPath: /host/proc
– name: sys
mountPath: /host/sys
hostNetwork: true
hostPID: true
volumes:
– name: proc
hostPath:
path: /proc
– name: sys
hostPath:
path: /sys
简单说就是node-exporter共享宿主机的环境,以便采集宿主机上的信息。
给它配置service的目的,是与prometheus的采集服务发现有关,就是说prometheus怎么知道node-exporter节点怎么访问呢? 需要service暴露一些信息,prometheus会监听相关变化以便获知node-exporter服务在哪里,然后调用它们的metrics接口采集数据。
所以service里的annotations是对prometheus有意义的,下面详细分析一下。
Prometheus的配置
我们需要配置prometheus采集什么数据。
我们采集一些k8s集群最基本的Metrics:
- apiserver的metrics,因为apiserver基本了解整个集群的情况。
- kubelet的metrics,因为kubelet负责node上容器的调度。
- kubelet里的cadvisor,因为cadvisor采集每个node上的容器内部信息。
- node-exporter,因为node-exporter采集每个node的宿主机资源。
Prometheus需要部署到k8s集群内,才能顺利和这些进程通讯,我们到k8s中应用的配置文件一般可以通过configmap保存,然后挂载到应用容器里。
那么要给prometheus配置啥呢?
- 首先给它访问apiserver的权限,一般就是申请一个特权serviceaccount,然后把token配置给它。
- 告诉prometheus去哪里采集。我们注意,prometheus并不关心采集到的metrics长什么样,那是使用者关心的事情。Prometheus只需要知道去哪里采集,这些目标地址叫做targets。
Prometheus支持访问apiserver监听k8s集群中endpoints列表,支持监听k8s集群中的nodes列表,还支持pods列表等等,这些东西都在etcd理存着,监听它们很正常。
所以我们要配置一些抓取(scrape)规则,覆盖所有我们需要抓取的targets,同时呢不要误抓到我们不需要的targets。
比如我们要抓所有node上的kubelet,我们可以用node自动发现,prometheus会得到所有的node列表,并且给我一次改写(relabel)的机会,我们改写的目的就是根据这些node的信息,输出我们要去哪里抓取kubelet的metrics。
我们看一下这个job配置:
# Scrape config for nodes (kubelet).
#
# Rather than connecting directly to the node, the scrape is proxied though the
# Kubernetes apiserver. This means it will work if Prometheus is running out of
# cluster, or can’t connect to nodes for some other reason (e.g. because of
# firewalling).
– job_name: ‘kubernetes-nodes’
# Default to scraping over https. If required, just disable this or change to
# http.
scheme: https
# This TLS & bearer token file config is used to connect to the actual scrape
# endpoints for cluster components. This is separate to discovery auth
# configuration because discovery & scraping are two separate concerns in
# Prometheus. The discovery auth config is automatic if Prometheus runs inside
# the cluster. Otherwise, more config options have to be provided within the
# <kubernetes_sd_config>.
tls_config:
ca_file: /var/run/secrets/kubernetes.io/serviceaccount/ca.crt
bearer_token_file: /var/run/secrets/kubernetes.io/serviceaccount/token
kubernetes_sd_configs:
– role: node
relabel_configs:
– action: labelmap
regex: __meta_kubernetes_node_label_(.+)
– target_label: __address__
replacement: kubernetes.default.svc:443
– source_labels: [__meta_kubernetes_node_name]
regex: (.+)
target_label: __metrics_path__
replacement: /api/v1/nodes/${1}/proxy/metrics
这个job的目标是抓取所有的kubelet进程,我们知道kubelet在每个node上都有,所以我们用 kubernetes_sd_configs:node服务发现。对于得到的每个node会有一些__meta开头的标签(prometheus的概念),例如符合正则__meta_kubernetes_node_label_(.+) 的标签其实是从k8s node上的标签转化过来的,我们可以对这些标签做判断,做改写等等。
上面配置最重要的,就是把target的抓取地址__address__改成了apiserver的k8s DNS地址kubernetes.default.svc:443 ,把抓取的接口改写成了/api/v1/nodes/${1}/proxy/metrics,也就是通过apiserver代理请求kubelet的metrics接口。 这里假设__meta_kubernetes_node_name是node01,那么target的完整抓取地址就是kubernetes.default.svc:443/api/v1/nodes/node01/proxy/metrics。
上述relabel处理发生在scrape抓取之前,用于基于prometheus已有的发现机制,进行一轮target地址改写,生成真正要抓取的target列表。
我们刚才给node-exporter建过service,并且还写了一些annotations,其实都对应我们的这条抓取规则:
# Example scrape config for service endpoints.
#
# The relabeling allows the actual service scrape endpoint to be configured
# for all or only some endpoints.
– job_name: ‘kubernetes-service-endpoints’
kubernetes_sd_configs:
– role: endpoints
relabel_configs:
# Example relabel to scrape only endpoints that have
# “prometheus.io/should_be_scraped = true” annotation.
– source_labels: [__meta_kubernetes_service_annotation_prometheus_io_should_be_scraped]
action: keep
regex: true
# Example relabel to customize metric path based on endpoints
# “prometheus.io/metric_path = <metric path>” annotation.
– source_labels: [__meta_kubernetes_service_annotation_prometheus_io_metric_path]
action: replace
target_label: __metrics_path__
regex: (.+)
# Example relabel to scrape only single, desired port for the service based
# on endpoints “prometheus.io/scrape_port = <port>” annotation.
– source_labels: [__address__, __meta_kubernetes_service_annotation_prometheus_io_scrape_port]
action: replace
regex: ([^:]+)(?::\d+)?;(\d+)
replacement: $1:$2
target_label: __address__
# Example relabel to configure scrape scheme for all service scrape targets
# based on endpoints “prometheus.io/scrape_scheme = <scheme>” annotation.
– source_labels: [__meta_kubernetes_service_annotation_prometheus_io_scrape_scheme]
action: replace
target_label: __scheme__
regex: (https?)
– action: labelmap
regex: __meta_kubernetes_service_label_(.+)
– source_labels: [__meta_kubernetes_namespace]
action: replace
target_label: kubernetes_namespace
– source_labels: [__meta_kubernetes_service_name]
action: replace
target_label: kubernetes_name
这次使用了:
kubernetes_sd_configs:
– role: endpoints
发现机制,每次创建service,就会为每个后端暴露的每个端口生成一个endpoints,并且endpoints会继承service的annotations。
下图service的端点包含了如何访问node-exporter的IP和PORT信息:
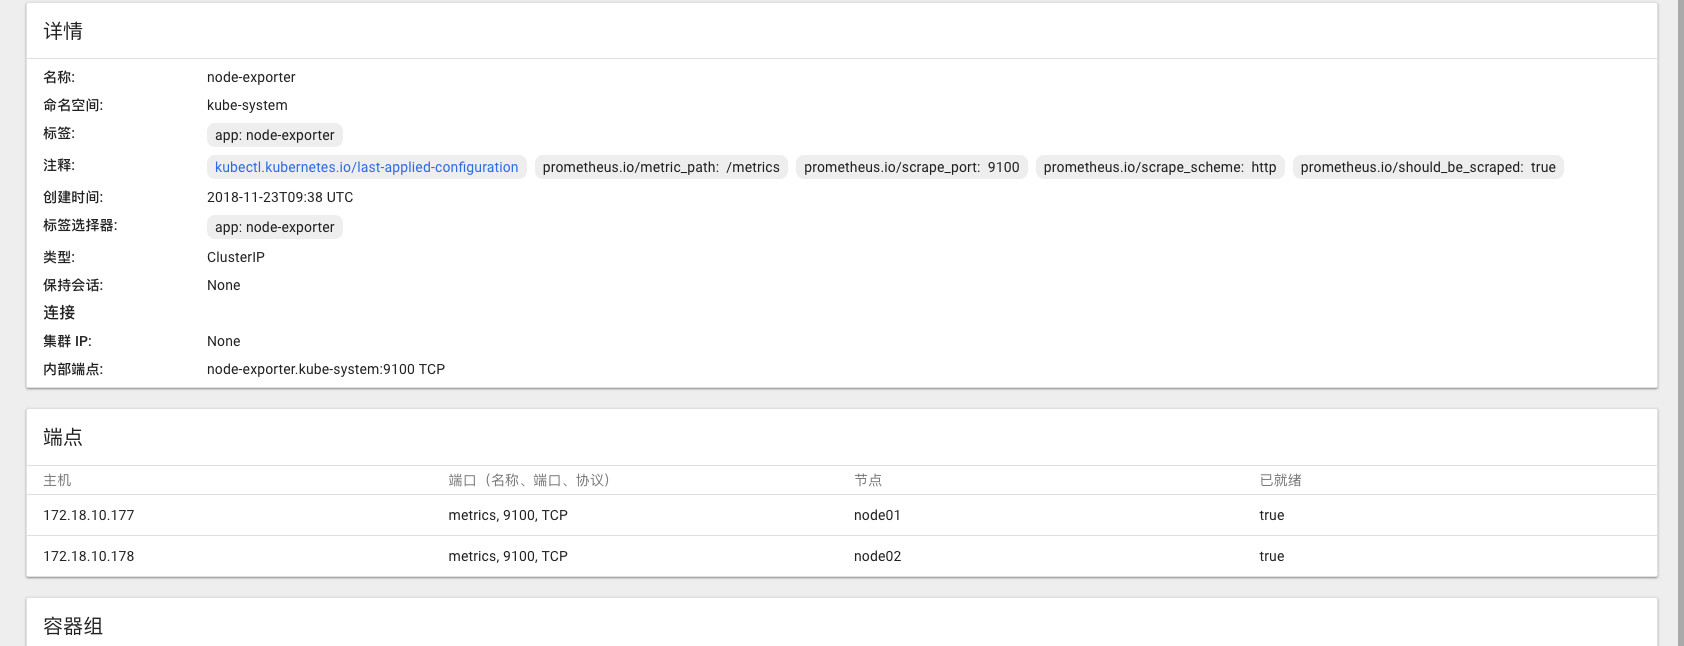
Prometheus的endpoints发现机制会把k8s endpoints的annotations带到__meta_kubernetes_service_annotation_prometheus_io_should_be_scraped这样的标签里,我们可以relabel的时候做处理,就可以生成访问到node-exporter的target地址了。
__meta_kubernetes_service_annotation_prometheus_io_should_be_scraped这个annotations用来帮助我们区分要不要抓取这个endpoints,只有为true的我们才会keep下来,生成target:
relabel_configs:
# Example relabel to scrape only endpoints that have
# “prometheus.io/should_be_scraped = true” annotation.
– source_labels: [__meta_kubernetes_service_annotation_prometheus_io_should_be_scraped]
action: keep
regex: true
所以说,这个job是一个非常通用的方案,基于service的endpoints实现服务发现,基于endpoints的annotations控制是否抓取、在什么端口、什么URI上抓取。
所以,该job的思路可以适用于任何k8s应用的抓取,具备通用型。
手动搭建的过程就不继续赘述了,理解上述原理可以帮助我们更好的使用开源整体解决方案,配置文件完整贴在下面了:
apiVersion: v1
kind: ConfigMap
metadata:
name: prometheus-server-config
labels:
name: prometheus-server-config
namespace: kube-system
data:
prometheus.yml: |-
# my global config
global:
scrape_interval: 15s # Set the scrape interval to every 15 seconds. Default is every 1 minute.
evaluation_interval: 15s # Evaluate rules every 15 seconds. The default is every 1 minute.
# scrape_timeout is set to the global default (10s).
# Alertmanager configuration
alerting:
alertmanagers:
– static_configs:
– targets:
# – alertmanager:9093
# Load rules once and periodically evaluate them according to the global ‘evaluation_interval’.
rule_files:
# – “first_rules.yml”
# – “second_rules.yml”
# A scrape configuration for running Prometheus on a Kubernetes cluster.
# This uses separate scrape configs for cluster components (i.e. API server, node)
# and services to allow each to use different authentication configs.
#
# Kubernetes labels will be added as Prometheus labels on metrics via the
# labelmap relabeling action.
#
# If you are using Kubernetes 1.7.2 or earlier, please take note of the comments
# for the kubernetes-cadvisor job; you will need to edit or remove this job.
# Scrape config for API servers.
#
# Kubernetes exposes API servers as endpoints to the default/kubernetes
# service so this uses endpoints role and uses relabelling to only keep
# the endpoints associated with the default/kubernetes service using the
# default named port https. This works for single API server deployments as
# well as HA API server deployments.
scrape_configs:
– job_name: ‘kubernetes-apiservers’
kubernetes_sd_configs:
– role: endpoints
# Default to scraping over https. If required, just disable this or change to
# http.
scheme: https
# This TLS & bearer token file config is used to connect to the actual scrape
# endpoints for cluster components. This is separate to discovery auth
# configuration because discovery & scraping are two separate concerns in
# Prometheus. The discovery auth config is automatic if Prometheus runs inside
# the cluster. Otherwise, more config options have to be provided within the
# <kubernetes_sd_config>.
tls_config:
ca_file: /var/run/secrets/kubernetes.io/serviceaccount/ca.crt
# If your node certificates are self-signed or use a different CA to the
# master CA, then disable certificate verification below. Note that
# certificate verification is an integral part of a secure infrastructure
# so this should only be disabled in a controlled environment. You can
# disable certificate verification by uncommenting the line below.
#
# insecure_skip_verify: true
bearer_token_file: /var/run/secrets/kubernetes.io/serviceaccount/token
# Keep only the default/kubernetes service endpoints for the https port. This
# will add targets for each API server which Kubernetes adds an endpoint to
# the default/kubernetes service.
relabel_configs:
– source_labels: [__meta_kubernetes_namespace, __meta_kubernetes_service_name, __meta_kubernetes_endpoint_port_name]
action: keep
regex: default;kubernetes;https
# Scrape config for nodes (kubelet).
#
# Rather than connecting directly to the node, the scrape is proxied though the
# Kubernetes apiserver. This means it will work if Prometheus is running out of
# cluster, or can’t connect to nodes for some other reason (e.g. because of
# firewalling).
– job_name: ‘kubernetes-nodes’
# Default to scraping over https. If required, just disable this or change to
# http.
scheme: https
# This TLS & bearer token file config is used to connect to the actual scrape
# endpoints for cluster components. This is separate to discovery auth
# configuration because discovery & scraping are two separate concerns in
# Prometheus. The discovery auth config is automatic if Prometheus runs inside
# the cluster. Otherwise, more config options have to be provided within the
# <kubernetes_sd_config>.
tls_config:
ca_file: /var/run/secrets/kubernetes.io/serviceaccount/ca.crt
bearer_token_file: /var/run/secrets/kubernetes.io/serviceaccount/token
kubernetes_sd_configs:
– role: node
relabel_configs:
– action: labelmap
regex: __meta_kubernetes_node_label_(.+)
– target_label: __address__
replacement: kubernetes.default.svc:443
– source_labels: [__meta_kubernetes_node_name]
regex: (.+)
target_label: __metrics_path__
replacement: /api/v1/nodes/${1}/proxy/metrics
# Scrape config for Kubelet cAdvisor.
#
# This is required for Kubernetes 1.7.3 and later, where cAdvisor metrics
# (those whose names begin with ‘container_’) have been removed from the
# Kubelet metrics endpoint. This job scrapes the cAdvisor endpoint to
# retrieve those metrics.
#
# In Kubernetes 1.7.0-1.7.2, these metrics are only exposed on the cAdvisor
# HTTP endpoint; use “replacement: /api/v1/nodes/${1}:4194/proxy/metrics”
# in that case (and ensure cAdvisor’s HTTP server hasn’t been disabled with
# the –cadvisor-port=0 Kubelet flag).
#
# This job is not necessary and should be removed in Kubernetes 1.6 and
# earlier versions, or it will cause the metrics to be scraped twice.
– job_name: ‘kubernetes-cadvisor’
# Default to scraping over https. If required, just disable this or change to
# http.
scheme: https
# This TLS & bearer token file config is used to connect to the actual scrape
# endpoints for cluster components. This is separate to discovery auth
# configuration because discovery & scraping are two separate concerns in
# Prometheus. The discovery auth config is automatic if Prometheus runs inside
# the cluster. Otherwise, more config options have to be provided within the
# <kubernetes_sd_config>.
tls_config:
ca_file: /var/run/secrets/kubernetes.io/serviceaccount/ca.crt
bearer_token_file: /var/run/secrets/kubernetes.io/serviceaccount/token
kubernetes_sd_configs:
– role: node
relabel_configs:
– action: labelmap
regex: __meta_kubernetes_node_label_(.+)
– target_label: __address__
replacement: kubernetes.default.svc:443
– source_labels: [__meta_kubernetes_node_name]
regex: (.+)
target_label: __metrics_path__
replacement: /api/v1/nodes/${1}/proxy/metrics/cadvisor
# Example scrape config for service endpoints.
#
# The relabeling allows the actual service scrape endpoint to be configured
# for all or only some endpoints.
– job_name: ‘kubernetes-service-endpoints’
kubernetes_sd_configs:
– role: endpoints
relabel_configs:
# Example relabel to scrape only endpoints that have
# “prometheus.io/should_be_scraped = true” annotation.
– source_labels: [__meta_kubernetes_service_annotation_prometheus_io_should_be_scraped]
action: keep
regex: true
# Example relabel to customize metric path based on endpoints
# “prometheus.io/metric_path = <metric path>” annotation.
– source_labels: [__meta_kubernetes_service_annotation_prometheus_io_metric_path]
action: replace
target_label: __metrics_path__
regex: (.+)
# Example relabel to scrape only single, desired port for the service based
# on endpoints “prometheus.io/scrape_port = <port>” annotation.
– source_labels: [__address__, __meta_kubernetes_service_annotation_prometheus_io_scrape_port]
action: replace
regex: ([^:]+)(?::\d+)?;(\d+)
replacement: $1:$2
target_label: __address__
# Example relabel to configure scrape scheme for all service scrape targets
# based on endpoints “prometheus.io/scrape_scheme = <scheme>” annotation.
– source_labels: [__meta_kubernetes_service_annotation_prometheus_io_scrape_scheme]
action: replace
target_label: __scheme__
regex: (https?)
– action: labelmap
regex: __meta_kubernetes_service_label_(.+)
– source_labels: [__meta_kubernetes_namespace]
action: replace
target_label: kubernetes_namespace
– source_labels: [__meta_kubernetes_service_name]
action: replace
target_label: kubernetes_name
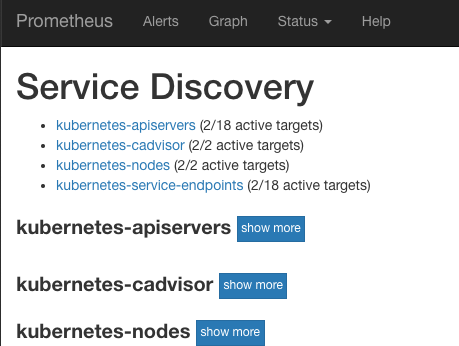
对于一个搭建起来的prometheus来说,下面的截图表示target自动发现配置正确,相关节点全部被监控了起来:
所以,下面我们把prometheus运行起来:
搭建prometheus
下面Yaml搭建了一个statefulset的单点prometheus,采用hostpath持久化数据以便重启prometheus时不会丢数据。
通过nodeSelector让它运行在node01上,不限制其资源使用。
通过updateStrategy控制有状态服务可以滚动升级,因为我们hostpath持久化了,所以数据得以保留。
建立一个nodePort的service供集群外访问。
apiVersion: v1
kind: Service
metadata:
labels:
app: prometheus-server
name: prometheus-server
namespace: kube-system
spec:
selector:
app: prometheus-server
type: NodePort
ports:
– name: prometheus
protocol: TCP
port: 9090
targetPort: 9090
—
apiVersion: apps/v1beta1
kind: StatefulSet
metadata:
name: prometheus-server
namespace: kube-system
spec:
replicas: 1
selector:
matchLabels:
app: prometheus-server
serviceName: prometheus-server
updateStrategy:
type: RollingUpdate
template:
metadata:
labels:
app: prometheus-server
spec:
nodeSelector:
kubernetes.io/hostname: “node01”
containers:
– name: prometheus
image: prom/prometheus
args:
– “–config.file=/prometheus/config/prometheus.yml”
– “–storage.tsdb.path=/prometheus/data”
– “–storage.tsdb.retention=72h”
volumeMounts:
– name: prometheus-config-volume
mountPath: /prometheus/config
– name: prometheus-data-volume
mountPath: /prometheus/data
env:
– name: v
value: “12”
volumes:
– name: prometheus-config-volume
configMap:
name: prometheus-server-config
– name: prometheus-data-volume
hostPath:
path: ‘/home/k8s/prometheus/data’
serviceAccountName: admin-user
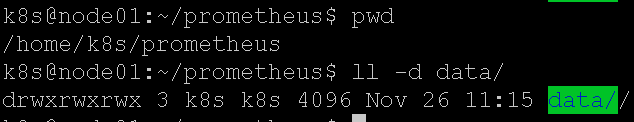
生效yaml之前,记得把/home/k8s/prometheus/data 目录建立出来,给与0777的权限,这样容器才能写入到宿主机的该目录内。
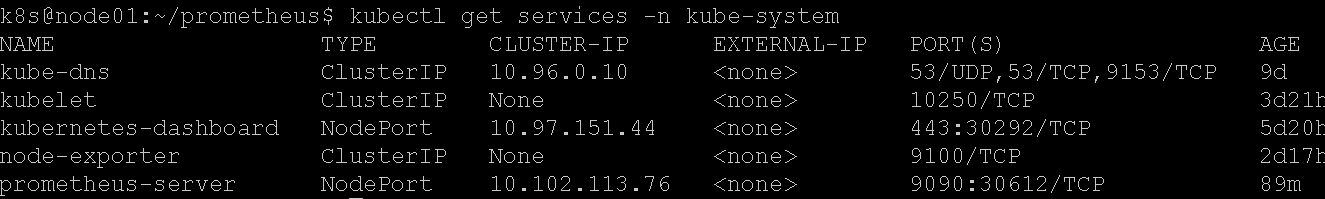
生效yaml后,查看一下service的nodePort是30612:
浏览器打开即可: 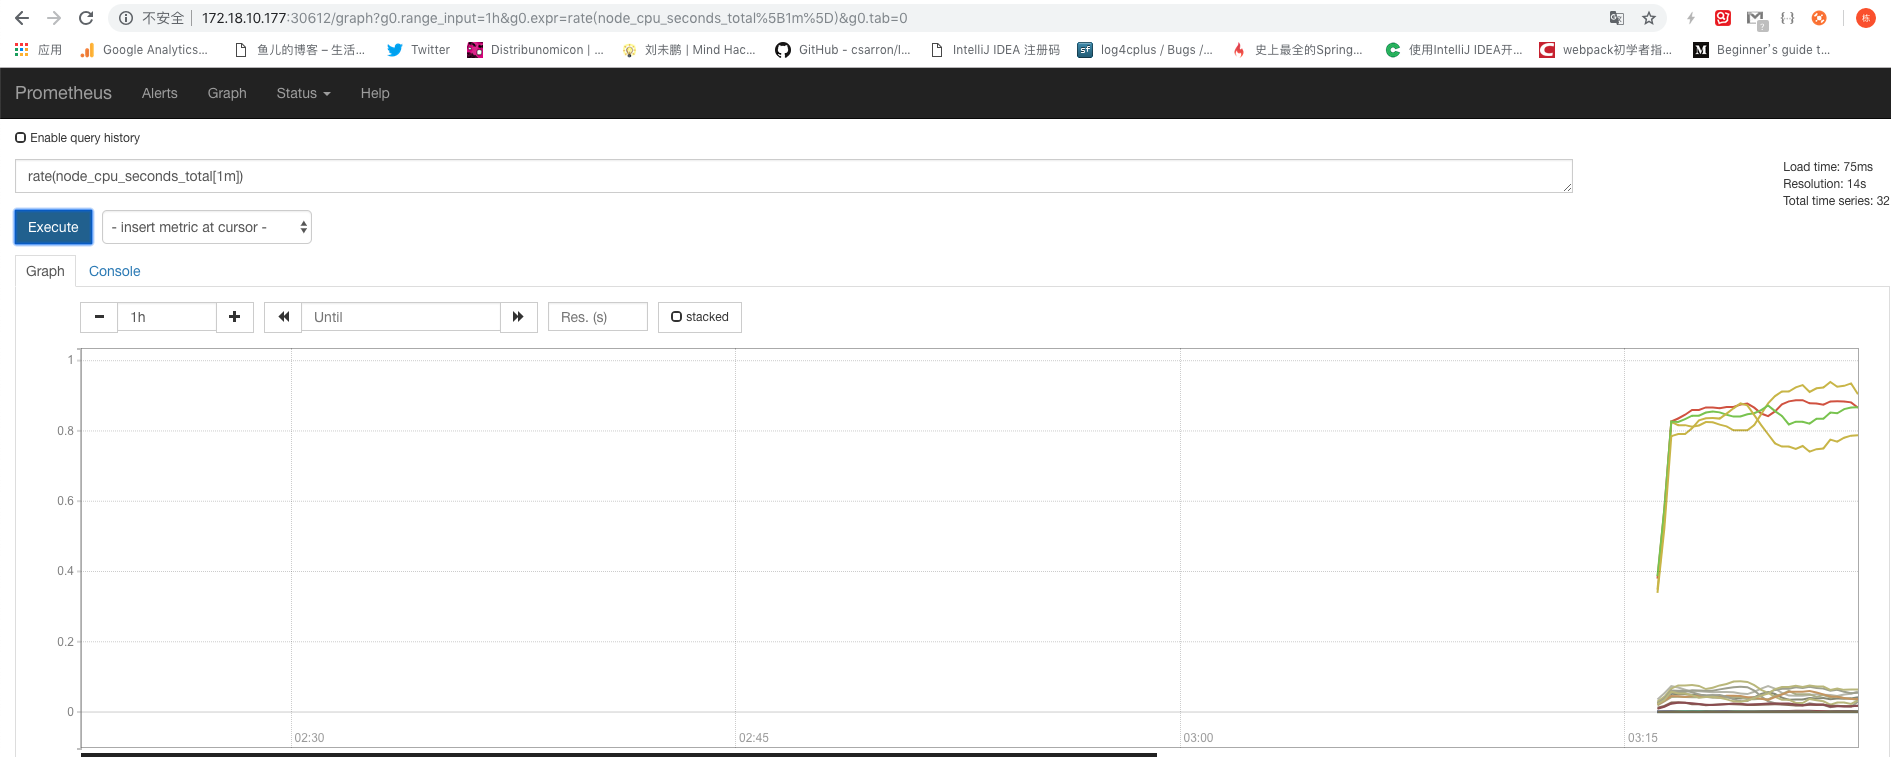
修改yaml中的Env,将v修改一下重新提交Yaml,确认重启statefulset数据不会丢失。
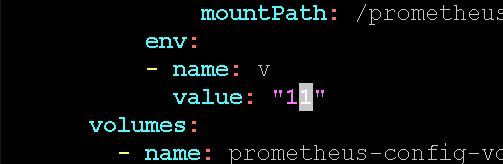

历史数据还在:
Prometheus告警
Prometheus支持配置监控表达式,prometheus通过定时的执行表达式,如果表达式成立(有符合条件的时序数据),那么就会触发告警。
Prometheus只负责告警计算,至于如何发送短信还是邮件之类的,会交给alertmanager处理,现在先试验一下prometheus这部分的告警计算。
我准备了下面的表达式,它计算了每个node的cpu平均idle率,小于0.9(即90%)符合条件,将作为输出触发对应node的告警:
avg(rate(node_cpu_seconds_total{mode=”idle”}[5m])) by (instance) < 0.9
更新prometheus-server-config.yml:
apiVersion: v1
kind: ConfigMap
metadata:
name: prometheus-server-config
labels:
name: prometheus-server-config
namespace: kube-system
data:
alert-rules.yml: |-
groups:
– name: k8s-alert
rules:
– alert: NodeCpuIdelTooLow
expr: ‘avg(rate(node_cpu_seconds_total{mode=”idle”}[5m])) by (instance) < 0.9’
for: 30s
annotations:
summary: “Node {{ $labels.instance }}’s CPU idle is too low”
description: “Node {{ $labels.instance }}’s CPU idle is {{ $value }} for 10 seconds!”
prometheus.yml: |-
# my global config
global:
scrape_interval: 15s # Set the scrape interval to every 15 seconds. Default is every 1 minute.
evaluation_interval: 15s # Evaluate rules every 15 seconds. The default is every 1 minute.
# scrape_timeout is set to the global default (10s).
# Alertmanager configuration
alerting:
alertmanagers:
– static_configs:
– targets:
# – alertmanager:9093
# Load rules once and periodically evaluate them according to the global ‘evaluation_interval’.
rule_files:
– “alert-rules.yml”
- 增加了alert-rules.yml告警配置文件,其中有一个监控项NodeCpuIdleTooLow,如果表达式连续成立30秒就会触发告警,要发送的警告信息可以通过annotations模板生成。
- 在prometheus.yml中配置了rule_files,指向了告警rules文件。
上传新的configmap:apply -f prometheus-server-config.yml。
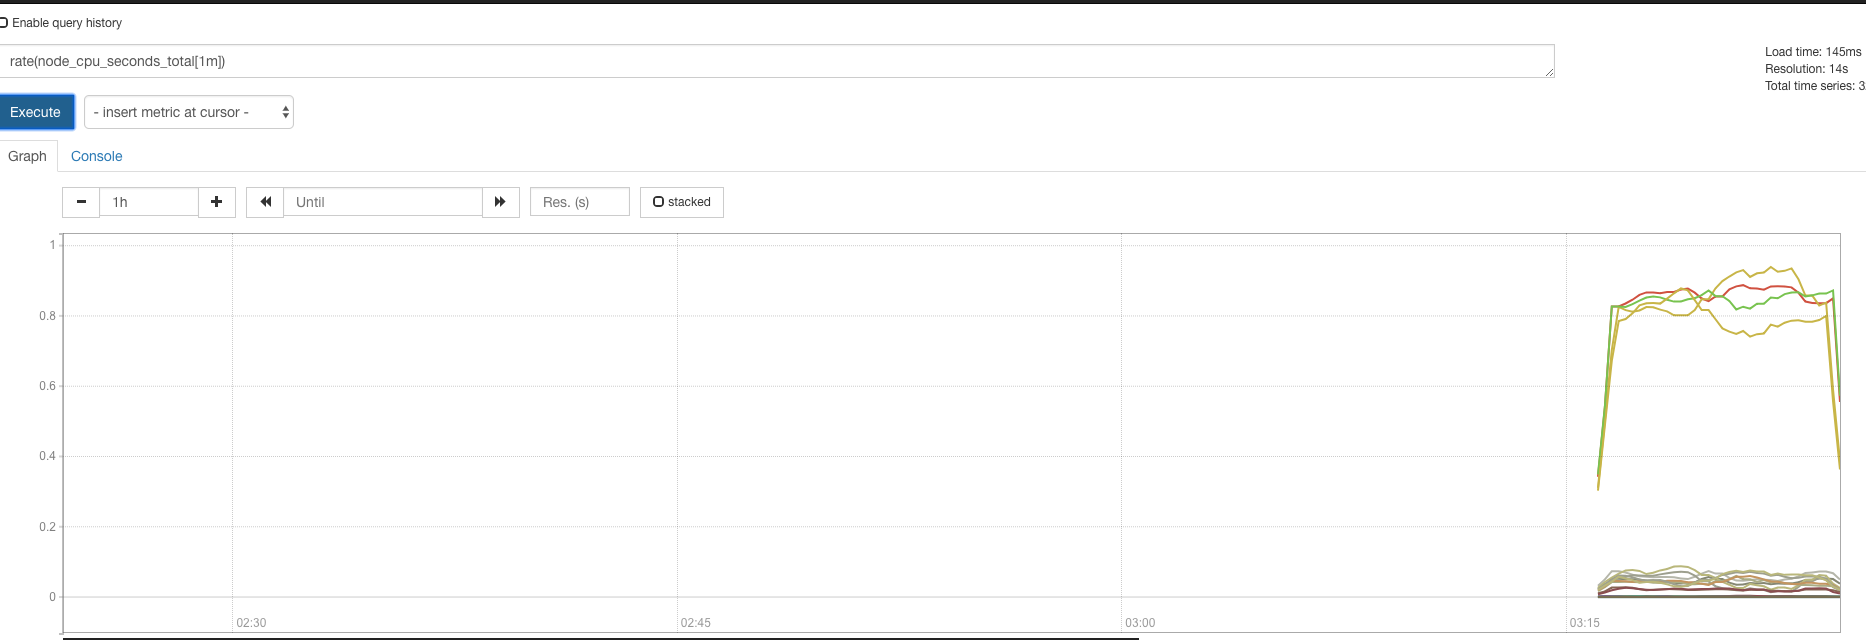
我们需要重启prometheus生效告警配置,所以我们修改prometheus.yml的podTemplate部分,让env中的v参数变化一下即可:
containers:
– name: prometheus
image: prom/prometheus
args:
– “–config.file=/prometheus/config/prometheus.yml”
– “–storage.tsdb.path=/prometheus/data”
– “–storage.tsdb.retention=72h”
volumeMounts:
– name: prometheus-config-volume
mountPath: /prometheus/config
– name: prometheus-data-volume
mountPath: /prometheus/data
env:
– name: v
value: “12”
apply -f 重启prometheus。
打开prometheus界面:
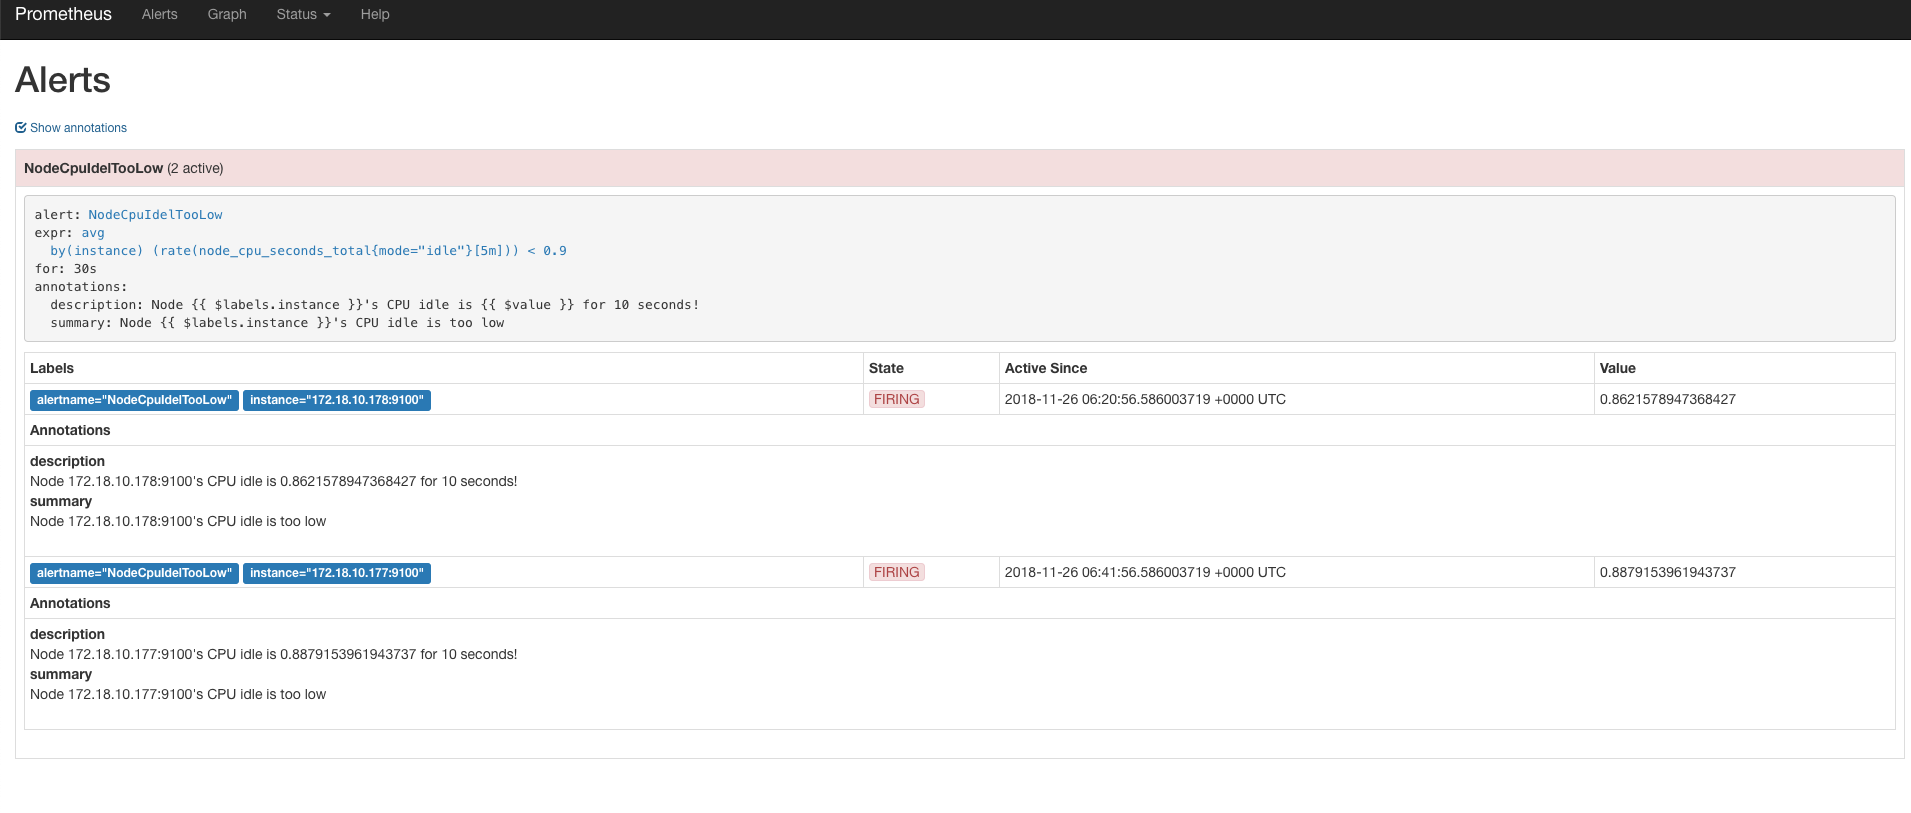
告警规则展示了出来,一开始处于pending状态表示满足条件,但不足30秒的for时间。 过了一会,发现状态已经是firing了,说明告警已经触发,如果我们配置了alert-manager的话,就会把告警发送出去了。
表达式输出了2条符合条件的时序数据,所以对应2条告警,annotations已经渲染出来了,符合我的期望。
alertmanager
alertmanger被prometheus调用,负责把告警通过邮件/HTTP/微信等各种渠道发送出去。
除了发送之外,它还支持报警消息的分组合并,告警收敛和静默等功能。
这里我只用一个最简单的配置,按prometheus中配置的告警规则名分组合并即可。
配置configmap
还是复用之前的prometheus的configmap,增加alertmanager的配置文件:
apiVersion: v1
kind: ConfigMap
metadata:
name: prometheus-server-config
labels:
name: prometheus-server-config
namespace: kube-system
data:
alertmanager.yml: |-
global:
smtp_smarthost: ‘smtp.smzdm.com:587’
smtp_from: ‘liangdong@smzdm.com’
smtp_auth_username: ‘liangdong@smzdm.com’
smtp_auth_password: ‘xxxxxx’
route:
group_by: [‘alertname’]
group_wait: 5s
group_interval: 5s
repeat_interval: 1m
receiver: default-receiver
receivers:
– name: ‘default-receiver’
email_configs:
– to: ‘liangdong@smzdm.com’
Route是主要规则部分,将发来的告警时序记录按照label: alertname分组,组内做消息合并和收敛:
Group_wait:组内收到第1条告警后5秒合并发送
Group_interval:组内已有告警的情况下,再来新告警则等待5秒后合并发送。
Repeat_interval:组内已有告警按照1分钟间隔重发。
告警通过smtp发送,但目前出现报错:
rr=”starttls failed: x509: certificate is valid for *.qiye.163.com, not smtp.smzdm.com”
因为我们企业邮箱用的163的,证书也是163的,但我们配的smtp服务器是smzdm.com域名的,所以客户端校验失败。 在下一个版本的alertmanager中将支持配置项不校验服务端证书,暂时先这样吧(alertmanager还支持HTTP webhook等)。
原先prometheus的配置添加了alertmanager服务的地址:
prometheus.yml: |-
# my global config
global:
scrape_interval: 15s # Set the scrape interval to every 15 seconds. Default is every 1 minute.
evaluation_interval: 15s # Evaluate rules every 15 seconds. The default is every 1 minute.
# scrape_timeout is set to the global default (10s).
# Alertmanager configuration
alerting:
alertmanagers:
– static_configs:
– targets:
– localhost:9093
为什么alertmanager通过Localhost:9093就可以访问呢?因为我计划把prometheus+alertmanager放在同一个statefulset的POD内,同一个POD内的container之间共享一个网络namespace。
service服务
alertmanager也有界面,我们继续复用prometheus的service配置,增加一个endpoint即可:
apiVersion: v1
kind: Service
metadata:
labels:
app: prometheus-server
name: prometheus-server
namespace: kube-system
spec:
selector:
app: prometheus-server
type: NodePort
ports:
– name: prometheus
protocol: TCP
port: 9090
targetPort: 9090
– name: alertmanager
protocol: TCP
port: 9093
targetPort: 9093
也就是说这个service把POD里的2个端口暴露了出来,会有2个nodePort。

Prometheus工作在POD内的9090,alertmanager工作在POD内的9093。
启动alertmanager
在prometheus的POD内,再添加一个container:
– name: alertmanager
image: quay.io/prometheus/alertmanager
args:
– “–config.file=/alertmanager/config/alertmanager.yml”
volumeMounts:
– name: prometheus-config-volume
mountPath: /alertmanager/config
– name: alertmanager-data-volume
mountPath: /alertmanager/data
env:
– name: v
value: “13”
volumes:
– name: prometheus-config-volume
configMap:
name: prometheus-server-config
– name: prometheus-data-volume
hostPath:
path: ‘/home/k8s/prometheus/data’
– name: alertmanager-data-volume
hostPath:
path: ‘/home/k8s/alertmanager/data’
serviceAccountName: admin-user
把alertmanager.yaml配置文件映射进来,同时hostPath一个持久化目录上来,记得给目录改权限0777。
apply -f Prometheus.yaml重新生效,现在可以通过service nodePort访问到alertmanager了:
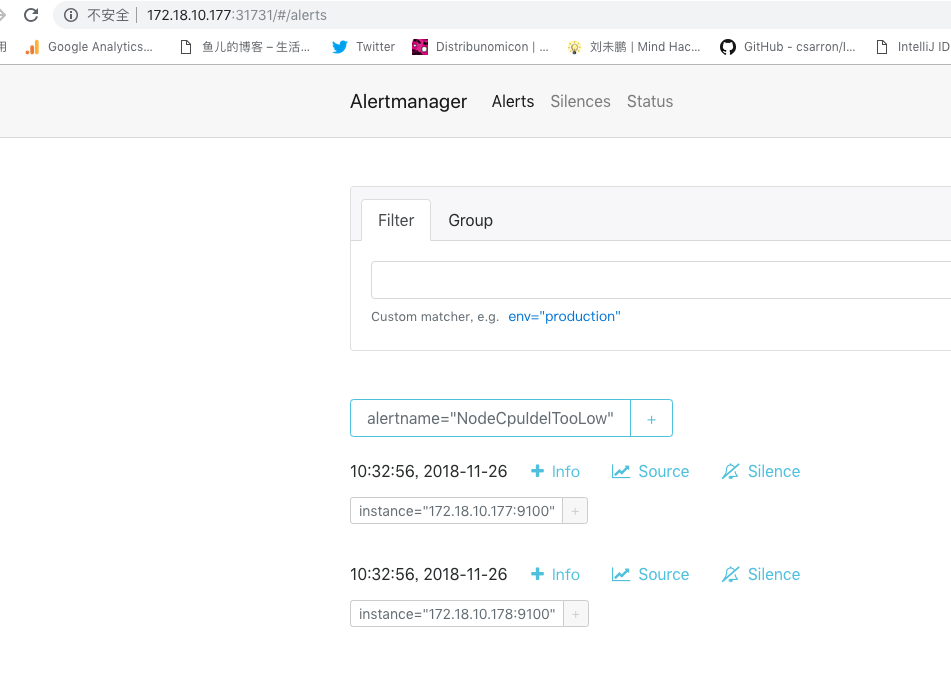
告警已经从prometheus推送过来了,按照alertname做了group组内的告警合并。
Grafana
Grafana通过请求prometheus执行查询获取时序数据,然后做图表展现。其实我们只需要在prometheus UI里调试好表达式,然后拿到grafana里配置一下图表就可以了。
Grafana的配置文件是ini格式的,同时支持通过环境变量的形式覆盖个别配置。
Grafana还支持通过配置文件预加载dashboard的配置(该功能叫做provisioning)。一般是先启动grafana,然后在UI中配置dashboard并保存,grafana会把UI中配置的dashboard存储到db里,默认是单机sqlite,也可以是mysql这种远程数据库。
生产环境应该用mysql来存dashboard配置提供可靠性,在这里我还是使用sqlite,把grafana的sqlite数据库通过hostPath映射到宿主机上,确保其重启时其db数据不会丢失,但宿主机故障配置就丢了。
安装grafana
安装参考:http://docs.grafana.org/installation/docker/
为了简单,我继续把grafana配置到之前prometheus的statefulset里。
修改prometheus.yaml,给service增加一个endpoint:
– name: grafana
protocol: TCP
port: 3000
targetPort: 3000
再增加一个volumes保存grafana的data:
– name: grafana-data-volume
hostPath:
path: ‘/home/k8s/grafana/data’
serviceAccountName: admin-user
再配置一个container到POD里:
– name: grafana
image: grafana/grafana
volumeMounts:
– name: grafana-data-volume
mountPath: /var/lib/grafana
env:
– name: v
value: “13”
– name: GF_LOG_MODE
value: “console”
这里通过环境变量覆盖了grafana的log配置,只输出到stdout/stderr(docker统一日志文件滚动,不会无限增长),不打日志文件,免得清理起来麻烦。
把hostPath挂载到/var/lib/grafana目录,这是grafana docker镜像配置的默认data存储路径。
生效yaml即可。
配置dashboard
查看一下grafana的service端口:

登录grafana,账号密码:admin admin
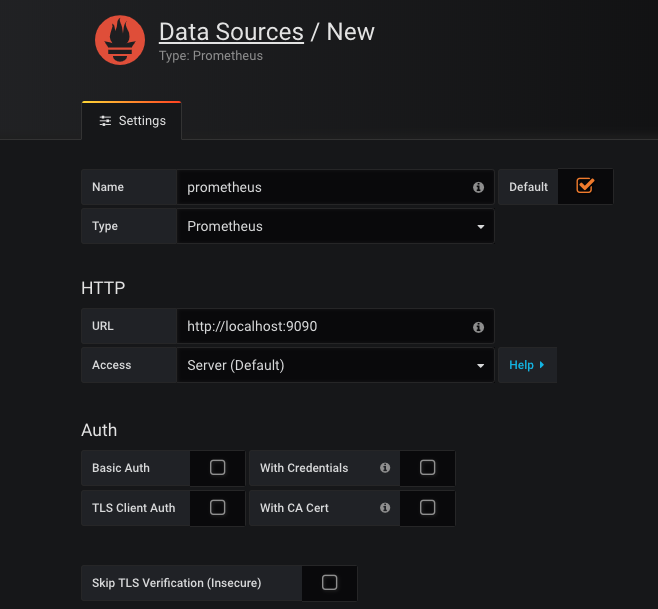
先配置一个datasource数据源,即本POD内的prometheus server:
然后添加dashboard。
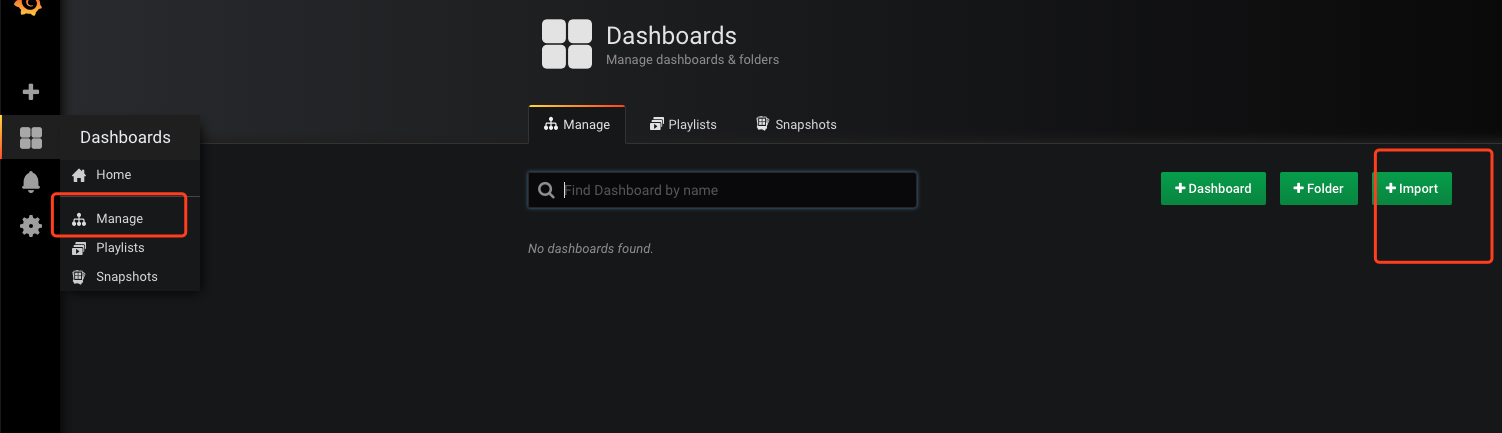
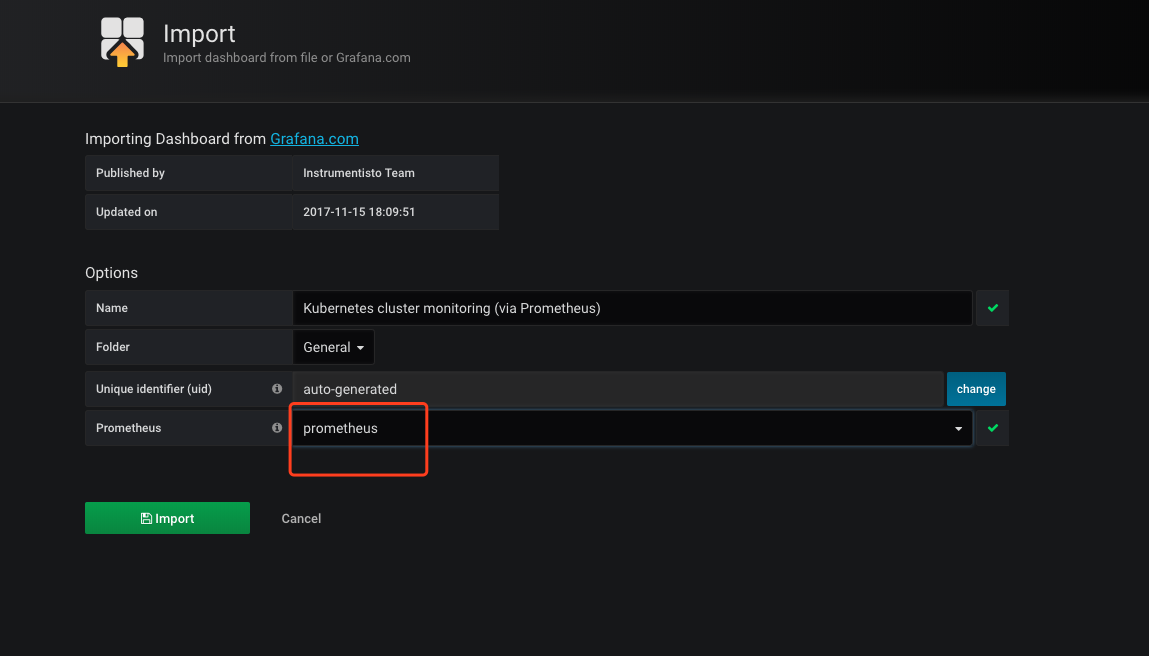
已经有开源dashboard配置了,所以我们只需要使用它们。
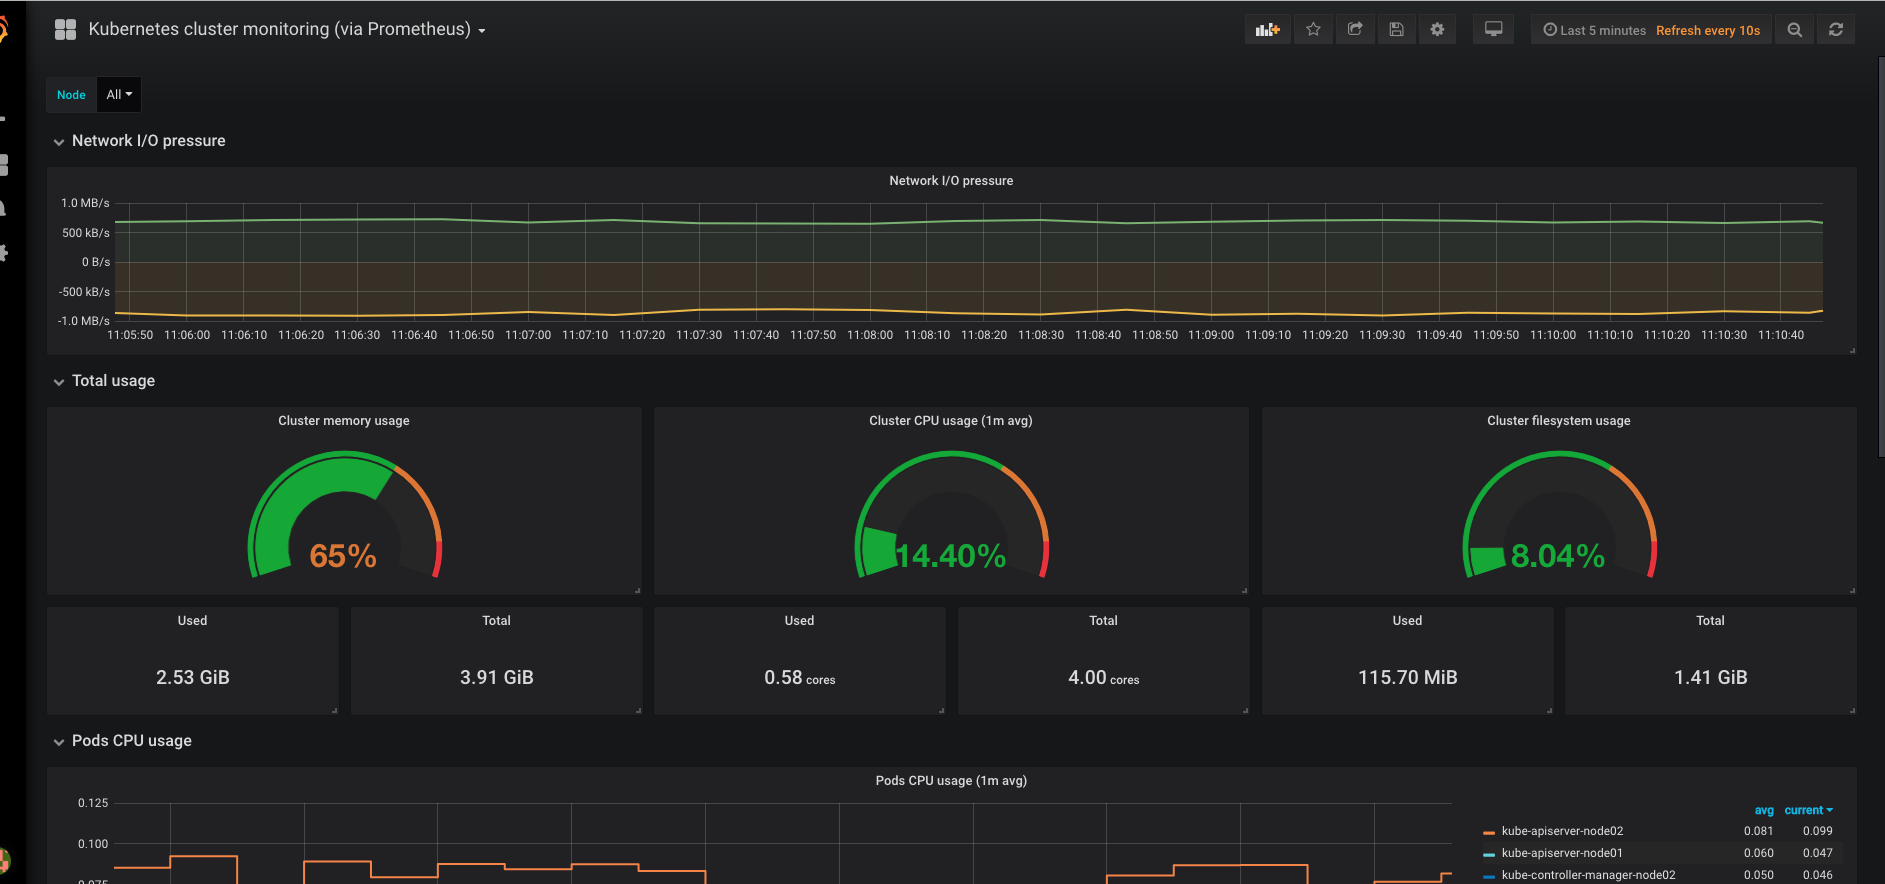
一个是cadvisor采集数据的展现,ID是315:
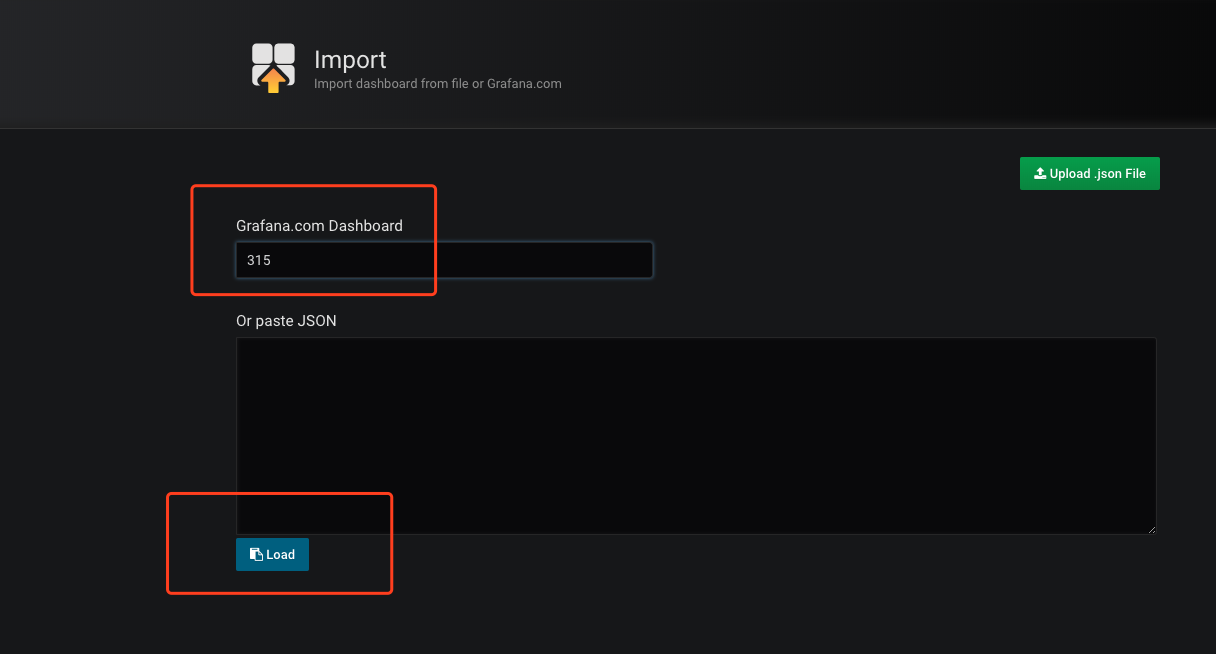
立即可以看到图表:
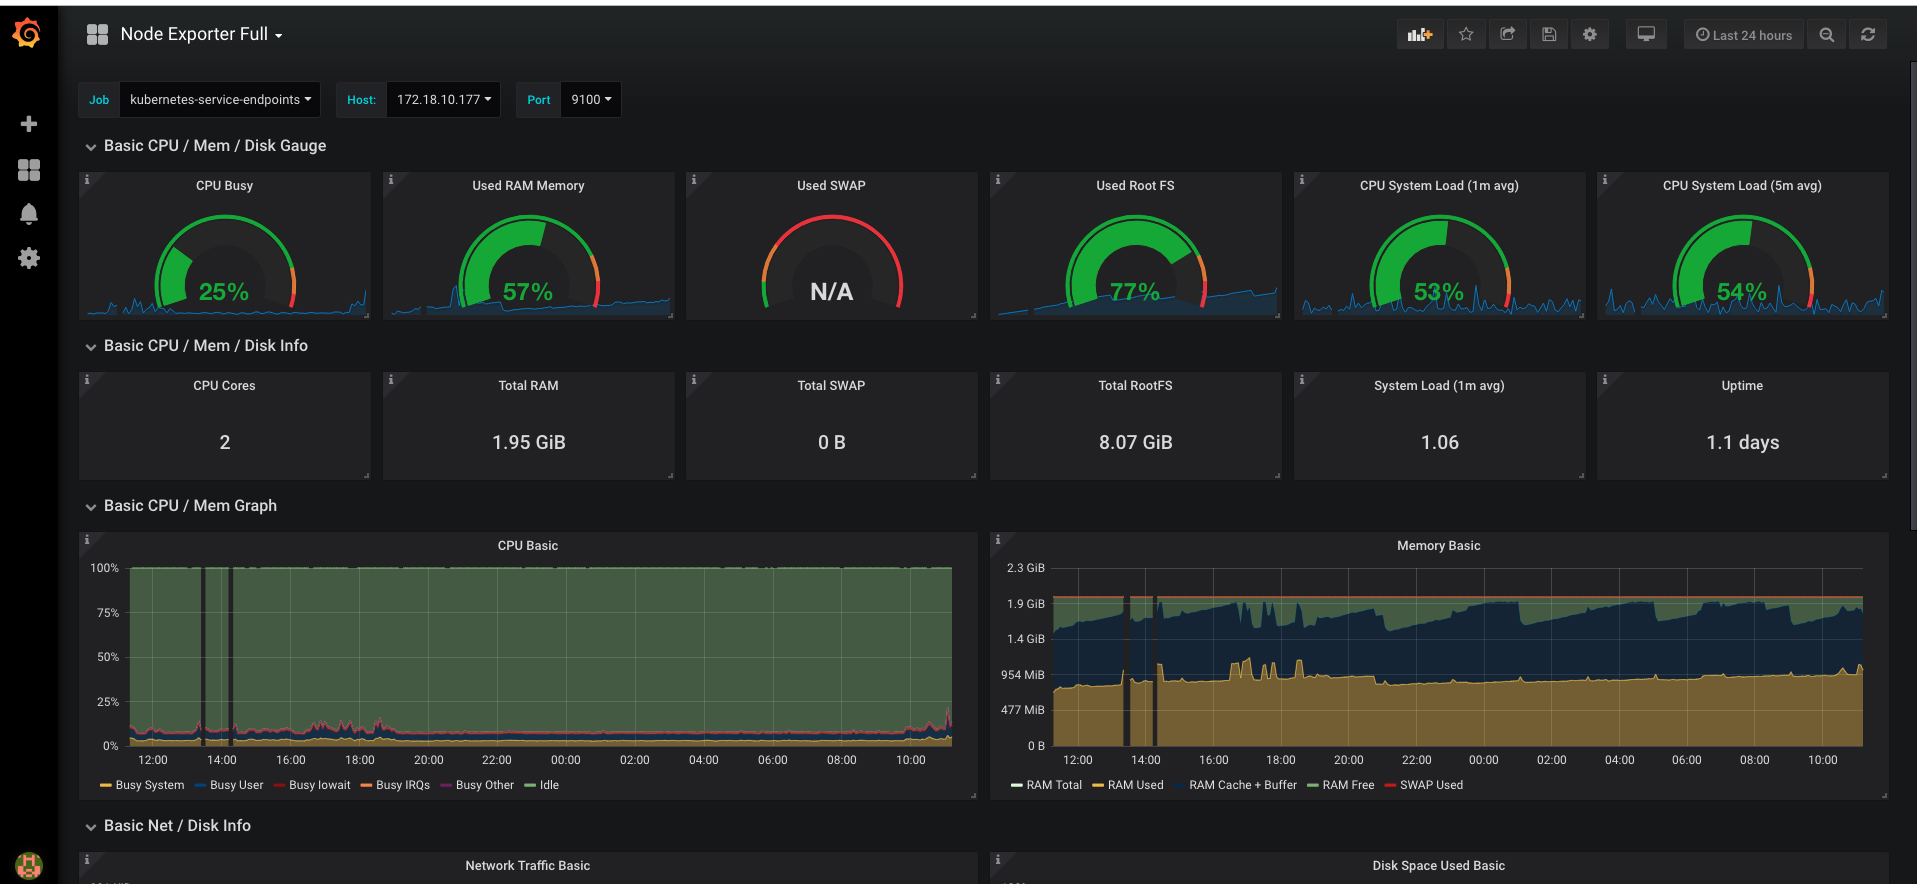
另外一个是node-exporter数据的展现,其ID是1860:
我们也可以自己设计dashboard,只要不嫌麻烦就行。
Dashboard原理
以node-exporter的dashboard为例:
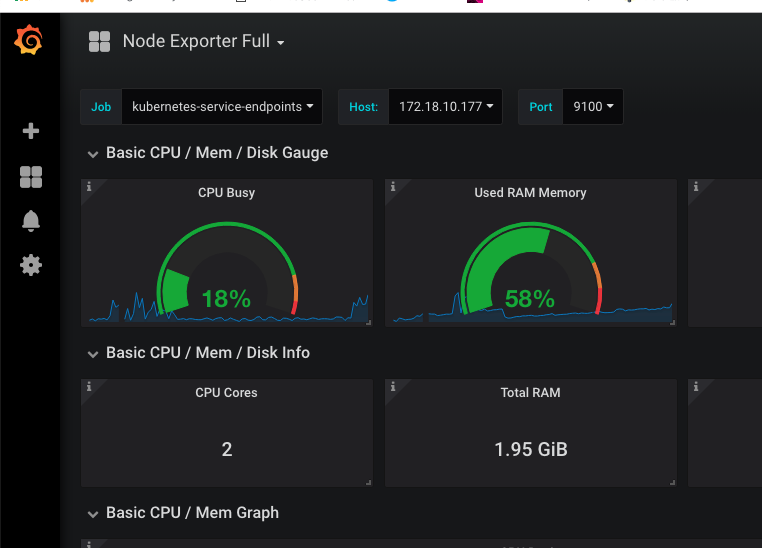
可以看到上方有一些选项,这些相当于dashboard的共用变量:
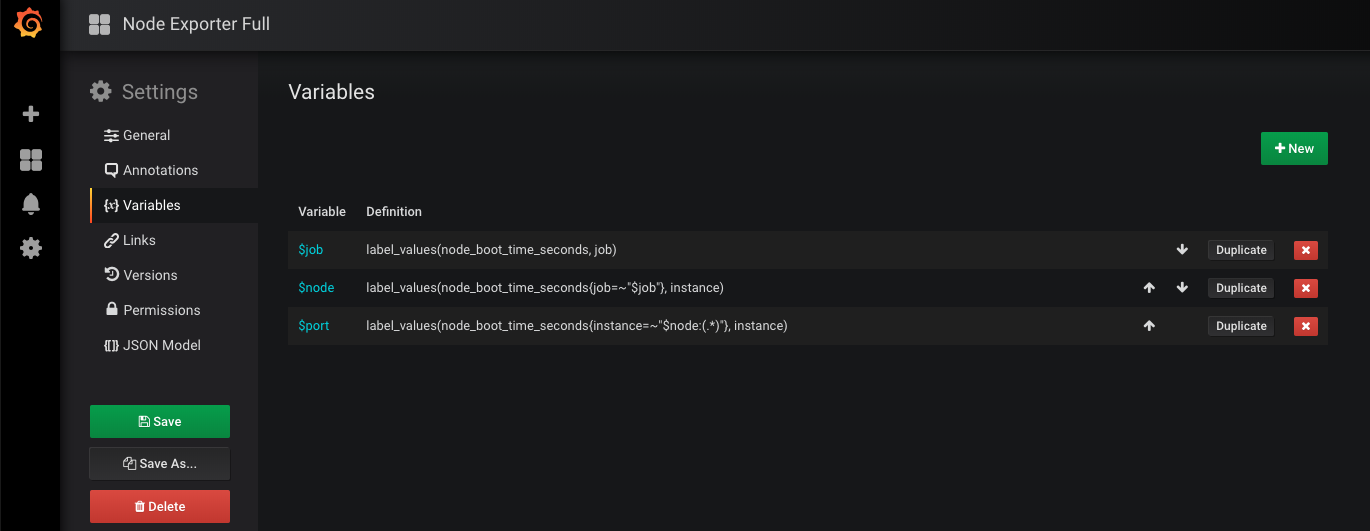
每个下拉框可以选择的内容是通过prometheus表达式计算出来的,比如$node包含了node01和node02,我们一旦选择其中之一$node就被赋值了。
接着,我们可以点某个仪表盘,选择edit看一下表达式:
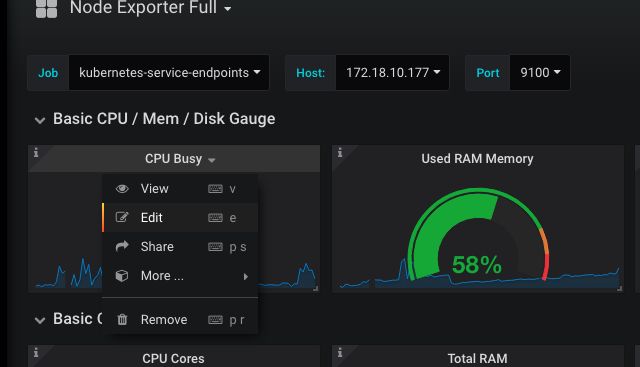
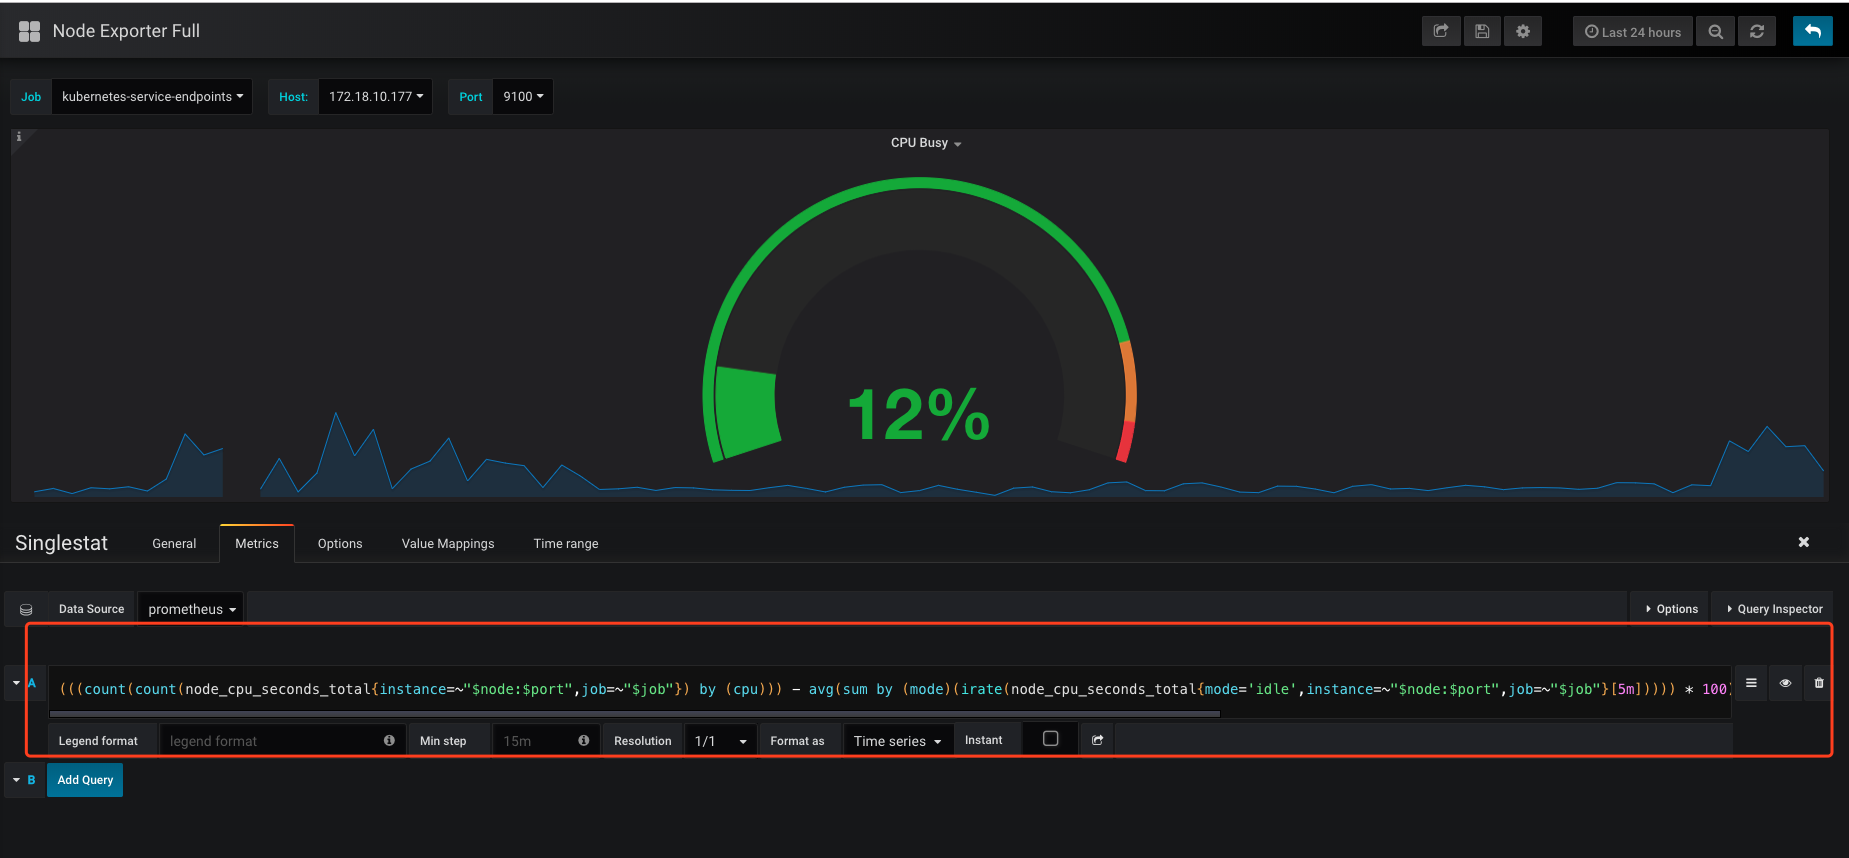
这个又臭又长的表达式就是发给prometheus的query了,其中$node和$job这些就是我们下拉选择变量了,会替换到query里,发给prometheus。
我们可以参考这些别人写的query,配置alertmanager实现告警,总比自己去琢磨各种metrics怎么算要简单的多。
其他
还有一些东西没有全部实践,比如:
- 通过部署kube-state-metrics,可以抓到k8s各种类型资源的metrics。
- 通过部署blackbox-exporter,可以实现对任意service的HTTP/TCP网络性能metrics。
但整体思路和关键原理经过实践都应有所把握,配置文件见文档末尾。
参考资料
- 后续在网上发现了类似的部署资料,供后续完善参考:
2,prometheus的热加载配置可以基于http接口触发:https://www.robustperception.io/reloading-prometheus-configuration
- 可以考虑是否使用kube-prometheus全栈方案,但目前也不成熟:https://github.com/coreos/kube-prometheus
Prometheus.yml
apiVersion: v1
kind: Service
metadata:
labels:
app: prometheus-server
name: prometheus-server
namespace: kube-system
spec:
selector:
app: prometheus-server
type: NodePort
ports:
– name: prometheus
protocol: TCP
port: 9090
targetPort: 9090
– name: alertmanager
protocol: TCP
port: 9093
targetPort: 9093
– name: grafana
protocol: TCP
port: 3000
targetPort: 3000
—
apiVersion: apps/v1beta1
kind: StatefulSet
metadata:
name: prometheus-server
namespace: kube-system
spec:
replicas: 1
selector:
matchLabels:
app: prometheus-server
serviceName: prometheus-server
updateStrategy:
type: RollingUpdate
template:
metadata:
labels:
app: prometheus-server
spec:
nodeSelector:
kubernetes.io/hostname: “node01”
containers:
– name: prometheus
image: prom/prometheus
args:
– “–config.file=/prometheus/config/prometheus.yml”
– “–storage.tsdb.path=/prometheus/data”
– “–storage.tsdb.retention=72h”
volumeMounts:
– name: prometheus-config-volume
mountPath: /prometheus/config
– name: prometheus-data-volume
mountPath: /prometheus/data
env:
– name: v
value: “13”
– name: alertmanager
image: quay.io/prometheus/alertmanager
args:
– “–config.file=/alertmanager/config/alertmanager.yml”
volumeMounts:
– name: prometheus-config-volume
mountPath: /alertmanager/config
– name: alertmanager-data-volume
mountPath: /alertmanager/data
env:
– name: v
value: “13”
– name: grafana
image: grafana/grafana
volumeMounts:
– name: grafana-data-volume
mountPath: /var/lib/grafana
env:
– name: v
value: “13”
– name: GF_LOG_MODE
value: “console”
volumes:
– name: prometheus-config-volume
configMap:
name: prometheus-server-config
– name: prometheus-data-volume
hostPath:
path: ‘/home/k8s/prometheus/data’
– name: alertmanager-data-volume
hostPath:
path: ‘/home/k8s/alertmanager/data’
– name: grafana-data-volume
hostPath:
path: ‘/home/k8s/grafana/data’
serviceAccountName: admin-user
Prometheus-server-config.yaml
apiVersion: v1
kind: ConfigMap
metadata:
name: prometheus-server-config
labels:
name: prometheus-server-config
namespace: kube-system
data:
alertmanager.yml: |-
global:
smtp_smarthost: ‘smtp.smzdm.com:587’
smtp_from: ‘liangdong@smzdm.com’
smtp_auth_username: ‘liangdong@smzdm.com’
smtp_auth_password: ‘xxxxxxx’
route:
group_by: [‘alertname’]
group_wait: 5s
group_interval: 5s
repeat_interval: 1m
receiver: default-receiver
receivers:
– name: ‘default-receiver’
email_configs:
– to: ‘liangdong@smzdm.com’
alert-rules.yml: |-
groups:
– name: k8s-alert
rules:
– alert: NodeCpuIdelTooLow
expr: ‘avg(rate(node_cpu_seconds_total{mode=”idle”}[5m])) by (instance) < 0.9’
for: 30s
annotations:
summary: “Node {{ $labels.instance }}’s CPU idle is too low”
description: “Node {{ $labels.instance }}’s CPU idle is {{ $value }} for 10 seconds!”
prometheus.yml: |-
# my global config
global:
scrape_interval: 15s # Set the scrape interval to every 15 seconds. Default is every 1 minute.
evaluation_interval: 15s # Evaluate rules every 15 seconds. The default is every 1 minute.
# scrape_timeout is set to the global default (10s).
# Alertmanager configuration
alerting:
alertmanagers:
– static_configs:
– targets:
– localhost:9093
# Load rules once and periodically evaluate them according to the global ‘evaluation_interval’.
rule_files:
– “alert-rules.yml”
# – “first_rules.yml”
# – “second_rules.yml”
# A scrape configuration for running Prometheus on a Kubernetes cluster.
# This uses separate scrape configs for cluster components (i.e. API server, node)
# and services to allow each to use different authentication configs.
#
# Kubernetes labels will be added as Prometheus labels on metrics via the
# labelmap relabeling action.
#
# If you are using Kubernetes 1.7.2 or earlier, please take note of the comments
# for the kubernetes-cadvisor job; you will need to edit or remove this job.
# Scrape config for API servers.
#
# Kubernetes exposes API servers as endpoints to the default/kubernetes
# service so this uses endpoints role and uses relabelling to only keep
# the endpoints associated with the default/kubernetes service using the
# default named port https. This works for single API server deployments as
# well as HA API server deployments.
scrape_configs:
– job_name: ‘kubernetes-apiservers’
kubernetes_sd_configs:
– role: endpoints
# Default to scraping over https. If required, just disable this or change to
# http.
scheme: https
# This TLS & bearer token file config is used to connect to the actual scrape
# endpoints for cluster components. This is separate to discovery auth
# configuration because discovery & scraping are two separate concerns in
# Prometheus. The discovery auth config is automatic if Prometheus runs inside
# the cluster. Otherwise, more config options have to be provided within the
# <kubernetes_sd_config>.
tls_config:
ca_file: /var/run/secrets/kubernetes.io/serviceaccount/ca.crt
# If your node certificates are self-signed or use a different CA to the
# master CA, then disable certificate verification below. Note that
# certificate verification is an integral part of a secure infrastructure
# so this should only be disabled in a controlled environment. You can
# disable certificate verification by uncommenting the line below.
#
# insecure_skip_verify: true
bearer_token_file: /var/run/secrets/kubernetes.io/serviceaccount/token
# Keep only the default/kubernetes service endpoints for the https port. This
# will add targets for each API server which Kubernetes adds an endpoint to
# the default/kubernetes service.
relabel_configs:
– source_labels: [__meta_kubernetes_namespace, __meta_kubernetes_service_name, __meta_kubernetes_endpoint_port_name]
action: keep
regex: default;kubernetes;https
# Scrape config for nodes (kubelet).
#
# Rather than connecting directly to the node, the scrape is proxied though the
# Kubernetes apiserver. This means it will work if Prometheus is running out of
# cluster, or can’t connect to nodes for some other reason (e.g. because of
# firewalling).
– job_name: ‘kubernetes-nodes’
# Default to scraping over https. If required, just disable this or change to
# http.
scheme: https
# This TLS & bearer token file config is used to connect to the actual scrape
# endpoints for cluster components. This is separate to discovery auth
# configuration because discovery & scraping are two separate concerns in
# Prometheus. The discovery auth config is automatic if Prometheus runs inside
# the cluster. Otherwise, more config options have to be provided within the
# <kubernetes_sd_config>.
tls_config:
ca_file: /var/run/secrets/kubernetes.io/serviceaccount/ca.crt
bearer_token_file: /var/run/secrets/kubernetes.io/serviceaccount/token
kubernetes_sd_configs:
– role: node
relabel_configs:
– action: labelmap
regex: __meta_kubernetes_node_label_(.+)
– target_label: __address__
replacement: kubernetes.default.svc:443
– source_labels: [__meta_kubernetes_node_name]
regex: (.+)
target_label: __metrics_path__
replacement: /api/v1/nodes/${1}/proxy/metrics
# Scrape config for Kubelet cAdvisor.
#
# This is required for Kubernetes 1.7.3 and later, where cAdvisor metrics
# (those whose names begin with ‘container_’) have been removed from the
# Kubelet metrics endpoint. This job scrapes the cAdvisor endpoint to
# retrieve those metrics.
#
# In Kubernetes 1.7.0-1.7.2, these metrics are only exposed on the cAdvisor
# HTTP endpoint; use “replacement: /api/v1/nodes/${1}:4194/proxy/metrics”
# in that case (and ensure cAdvisor’s HTTP server hasn’t been disabled with
# the –cadvisor-port=0 Kubelet flag).
#
# This job is not necessary and should be removed in Kubernetes 1.6 and
# earlier versions, or it will cause the metrics to be scraped twice.
– job_name: ‘kubernetes-cadvisor’
# Default to scraping over https. If required, just disable this or change to
# http.
scheme: https
# This TLS & bearer token file config is used to connect to the actual scrape
# endpoints for cluster components. This is separate to discovery auth
# configuration because discovery & scraping are two separate concerns in
# Prometheus. The discovery auth config is automatic if Prometheus runs inside
# the cluster. Otherwise, more config options have to be provided within the
# <kubernetes_sd_config>.
tls_config:
ca_file: /var/run/secrets/kubernetes.io/serviceaccount/ca.crt
bearer_token_file: /var/run/secrets/kubernetes.io/serviceaccount/token
kubernetes_sd_configs:
– role: node
relabel_configs:
– action: labelmap
regex: __meta_kubernetes_node_label_(.+)
– target_label: __address__
replacement: kubernetes.default.svc:443
– source_labels: [__meta_kubernetes_node_name]
regex: (.+)
target_label: __metrics_path__
replacement: /api/v1/nodes/${1}/proxy/metrics/cadvisor
# Example scrape config for service endpoints.
#
# The relabeling allows the actual service scrape endpoint to be configured
# for all or only some endpoints.
– job_name: ‘kubernetes-service-endpoints’
kubernetes_sd_configs:
– role: endpoints
relabel_configs:
# Example relabel to scrape only endpoints that have
# “prometheus.io/should_be_scraped = true” annotation.
– source_labels: [__meta_kubernetes_service_annotation_prometheus_io_should_be_scraped]
action: keep
regex: true
# Example relabel to customize metric path based on endpoints
# “prometheus.io/metric_path = <metric path>” annotation.
– source_labels: [__meta_kubernetes_service_annotation_prometheus_io_metric_path]
action: replace
target_label: __metrics_path__
regex: (.+)
# Example relabel to scrape only single, desired port for the service based
# on endpoints “prometheus.io/scrape_port = <port>” annotation.
– source_labels: [__address__, __meta_kubernetes_service_annotation_prometheus_io_scrape_port]
action: replace
regex: ([^:]+)(?::\d+)?;(\d+)
replacement: $1:$2
target_label: __address__
# Example relabel to configure scrape scheme for all service scrape targets
# based on endpoints “prometheus.io/scrape_scheme = <scheme>” annotation.
– source_labels: [__meta_kubernetes_service_annotation_prometheus_io_scrape_scheme]
action: replace
target_label: __scheme__
regex: (https?)
– action: labelmap
regex: __meta_kubernetes_service_label_(.+)
– source_labels: [__meta_kubernetes_namespace]
action: replace
target_label: kubernetes_namespace
– source_labels: [__meta_kubernetes_service_name]
action: replace
target_label: kubernetes_name
node-exporter.yml
apiVersion: v1
kind: Service
metadata:
name: node-exporter
namespace: kube-system
labels:
app: node-exporter
annotations:
prometheus.io/should_be_scraped: “true”
prometheus.io/metric_path: “/metrics”
prometheus.io/scrape_port: “9100”
prometheus.io/scrape_scheme: “http”
spec:
clusterIP: None
ports:
– name: metrics
port: 9100
targetPort: 9100
protocol: TCP
selector:
app: node-exporter
type: ClusterIP
—
apiVersion: apps/v1beta2
kind: DaemonSet
metadata:
labels:
app: node-exporter
name: node-exporter
namespace: kube-system
spec:
selector:
matchLabels:
app: node-exporter
template:
metadata:
labels:
app: node-exporter
spec:
containers:
– name: node-exporter
image: quay.io/prometheus/node-exporter
args:
– ‘–path.procfs=/host/proc’
– ‘–path.sysfs=/host/sys’
volumeMounts:
– name: proc
mountPath: /host/proc
– name: sys
mountPath: /host/sys
hostNetwork: true
hostPID: true
volumes:
– name: proc
hostPath:
path: /proc
– name: sys
hostPath:
path: /sys
如果文章帮助您解决了工作难题,您可以帮我点击屏幕上的任意广告,或者赞助少量费用来支持我的持续创作,谢谢~

1